
- Overview of the component
- How component is accessed
- Access controls for the component
- How to deploy the component using Terraform
- An example of how to enable post-deployment configuration (if required)
- How to perform a backup and restoration
- How to conduct DR (fail-over and fail-back) and services recovery
- How to scale resources (in/out and up/down) where applicable
- How to upgrade a resource
Overview of the component
The focus of this SOP is to provide an overview of the Azure Monitor used widely in the azure platform to monitor and alert on any events occurred in the hosted Azure services.
Azure Monitor helps you maximize the availability and performance of your applications and services. It delivers a comprehensive solution for collecting, analysing, and acting on telemetry from your cloud and on-premises environments. This information helps you understand how your applications are performing and proactively identify issues affecting them and the resources they depend on.
How component is accessed
The Azure Monitor can be accessed via the Azure Portal for each Azure subscriptions where they have been configured for alerts.
Access all Azure Monitor features and data from the Monitor menu in the Azure portal. The Monitoring section of the menu for different Azure services provides access to the same tools with data filtered to a particular resource. Azure Monitor data is also accessible for a variety of scenarios using CLI, PowerShell, and a REST API.
Azure Monitor can be found in the Azure subscriptions by searching for ‘Monitor’ in the Azure portal
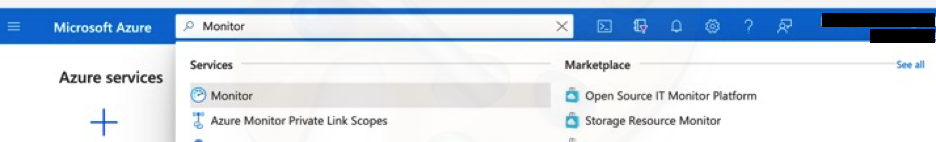
This will then load the Azure Monitor center where we can view all options related to azure monitoring and alerting can be viewed.
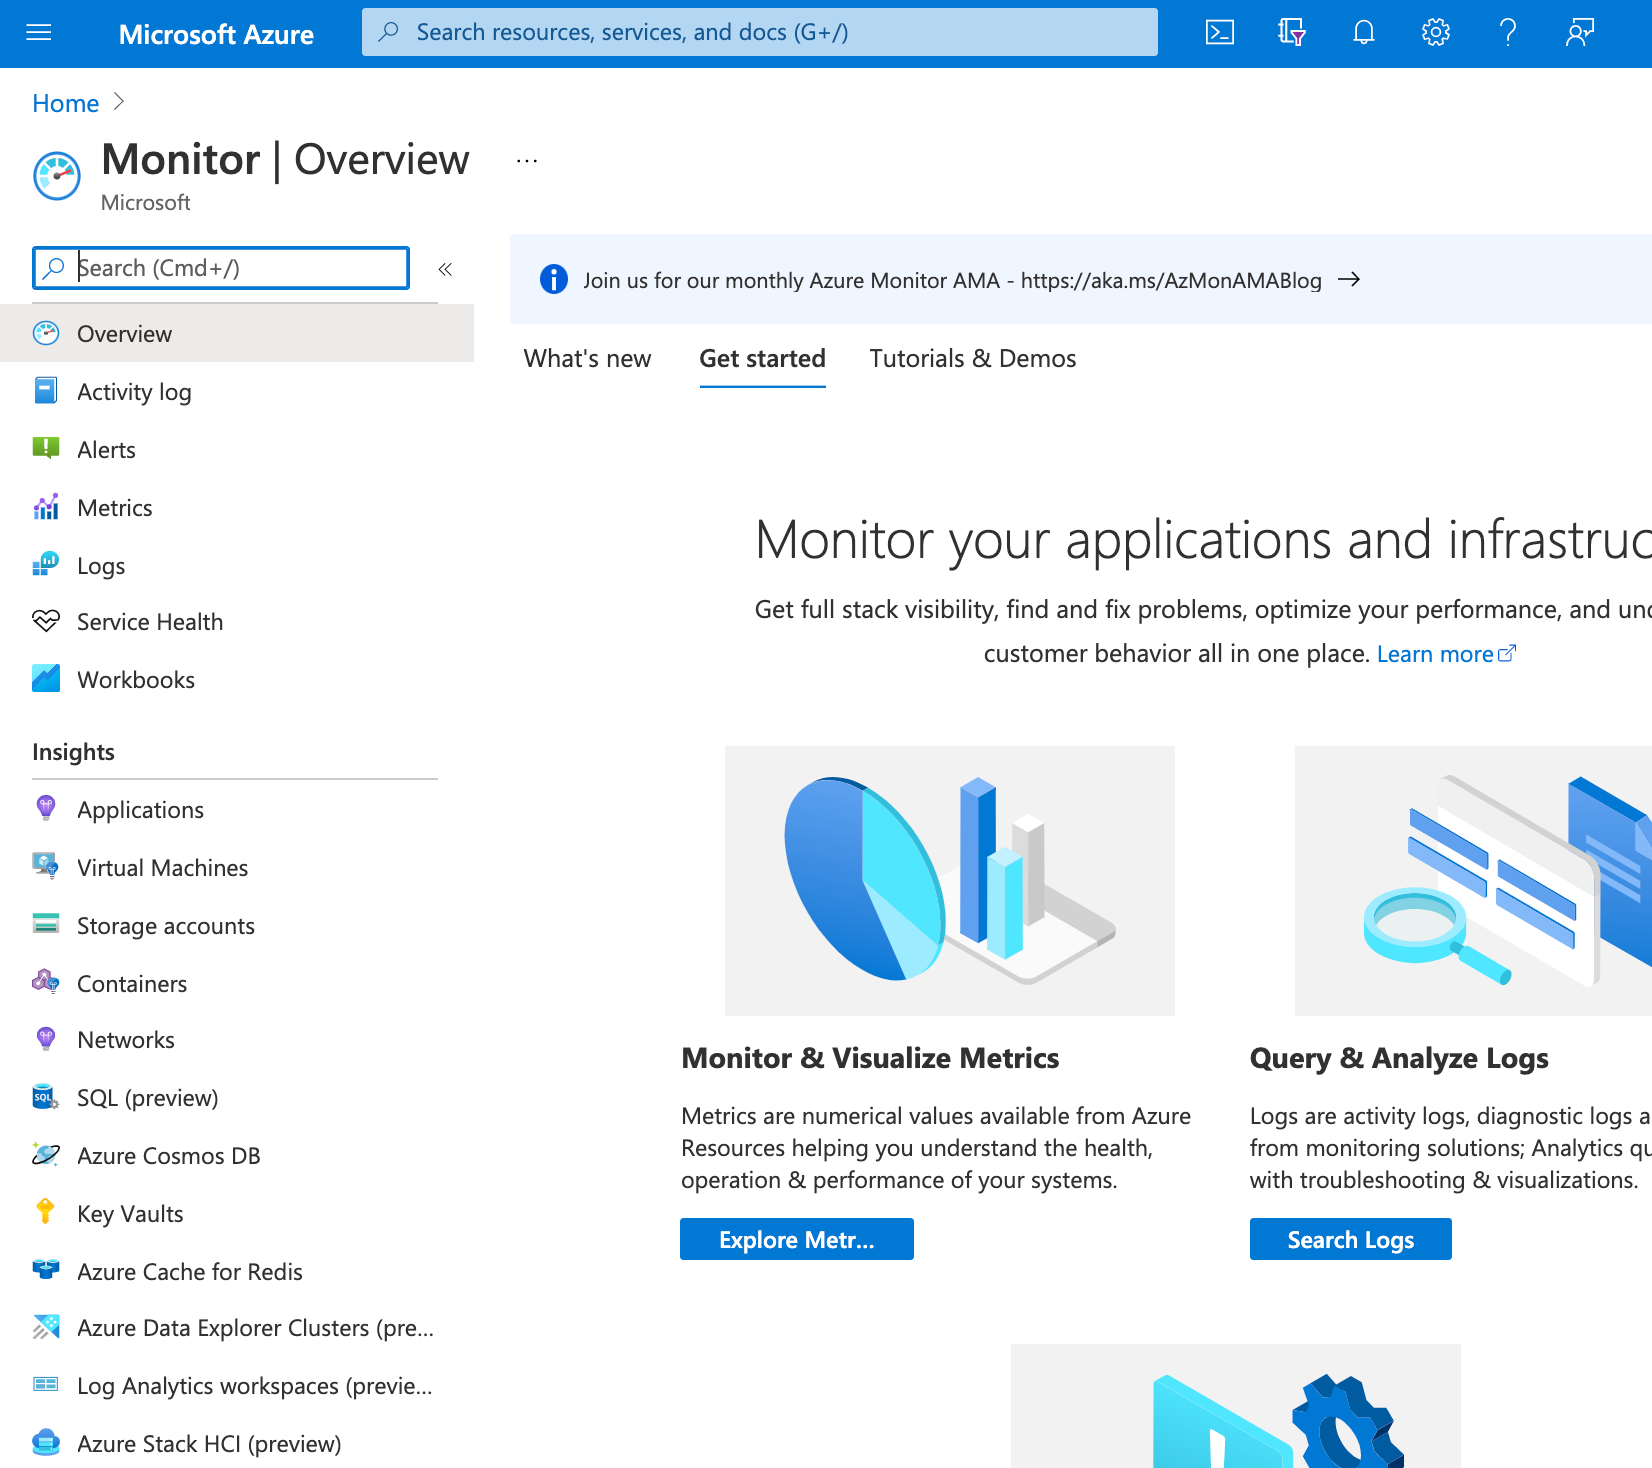
Click on Alerts in the right-hand side control pane menu and you will find an overview of alerts defined currently in Azure Monitoring
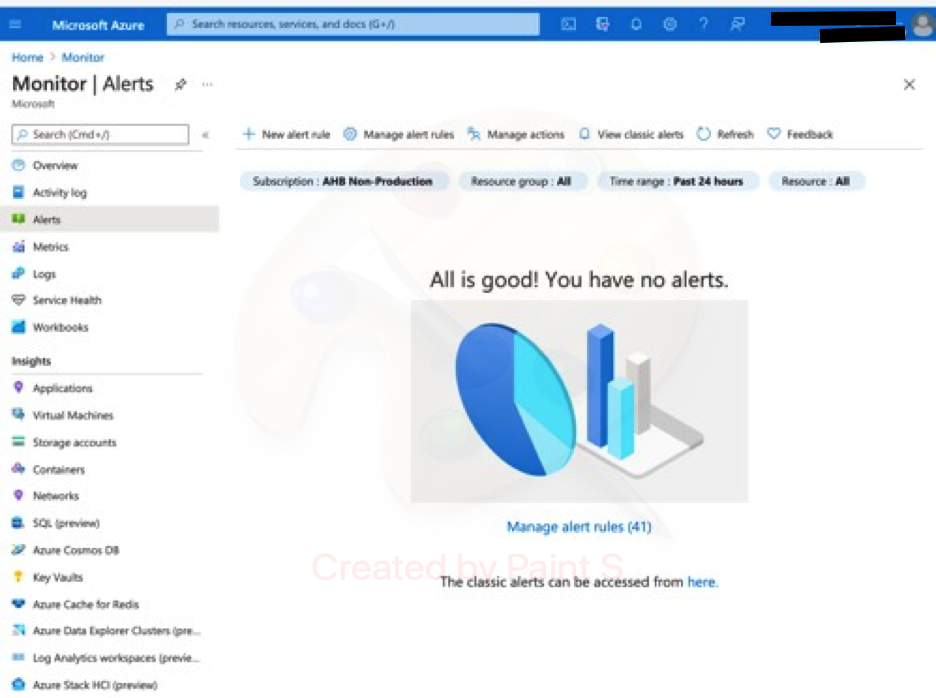
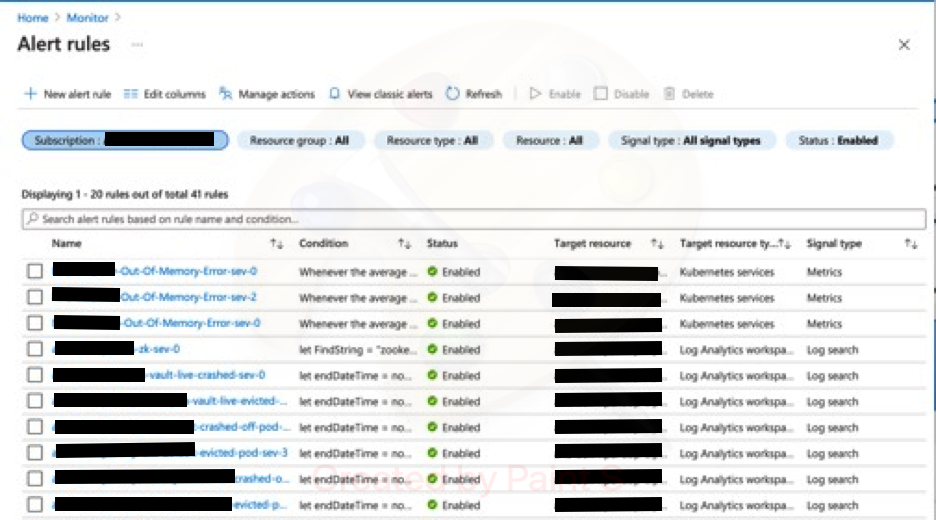
Click the “Manage Alert rules” menu option on the top of the display plane on left-hand side, which will take you to the Manage Alerts centre and lists all the existing alerts which are configured for that specific subscription.
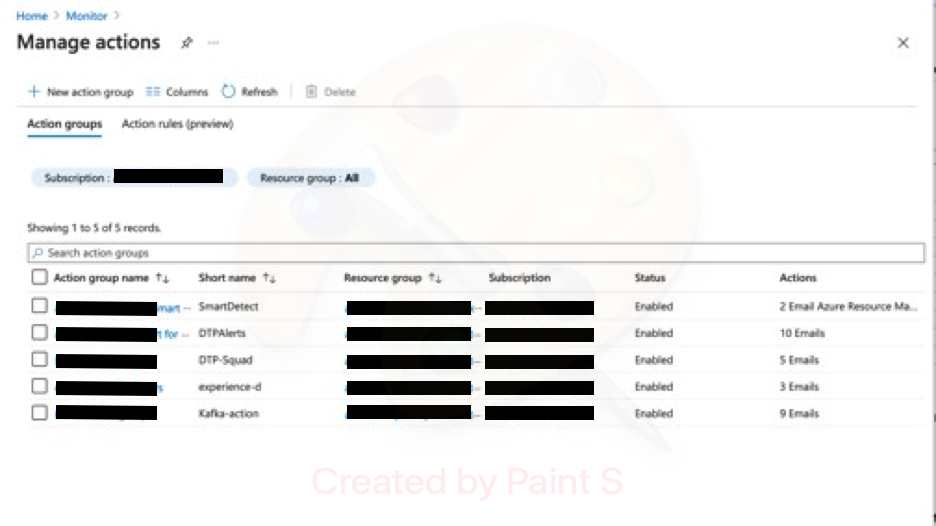
Click on “Manage actions” menu option on the top of the display plane on left-hand side, which will take you to the Manage action groups centre and lists all the existing action groups created.
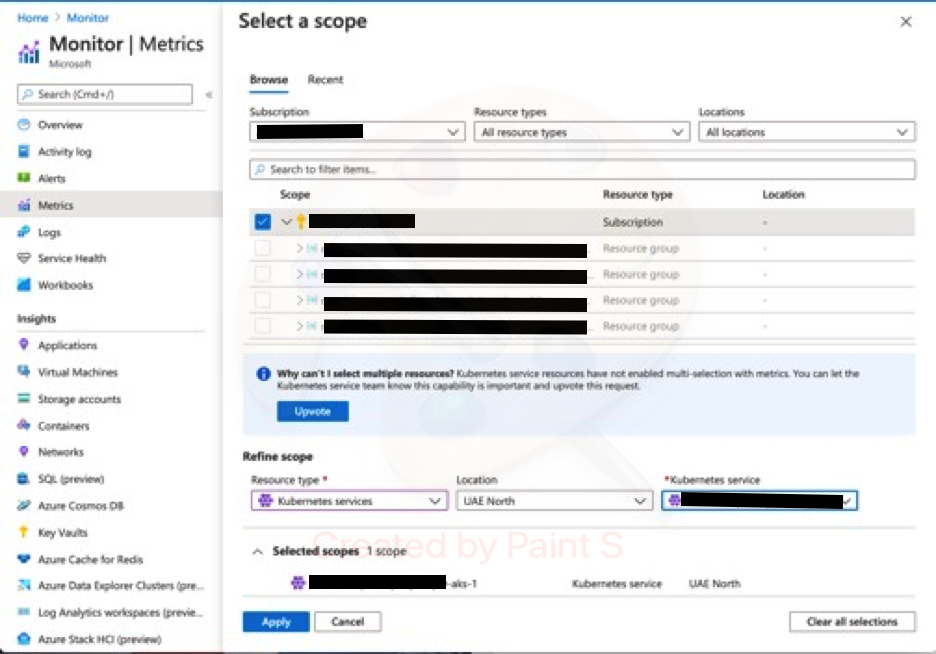
Click the Metrics tab and you will be asked to select the resource for which you wish to want the metrics to be displayed.
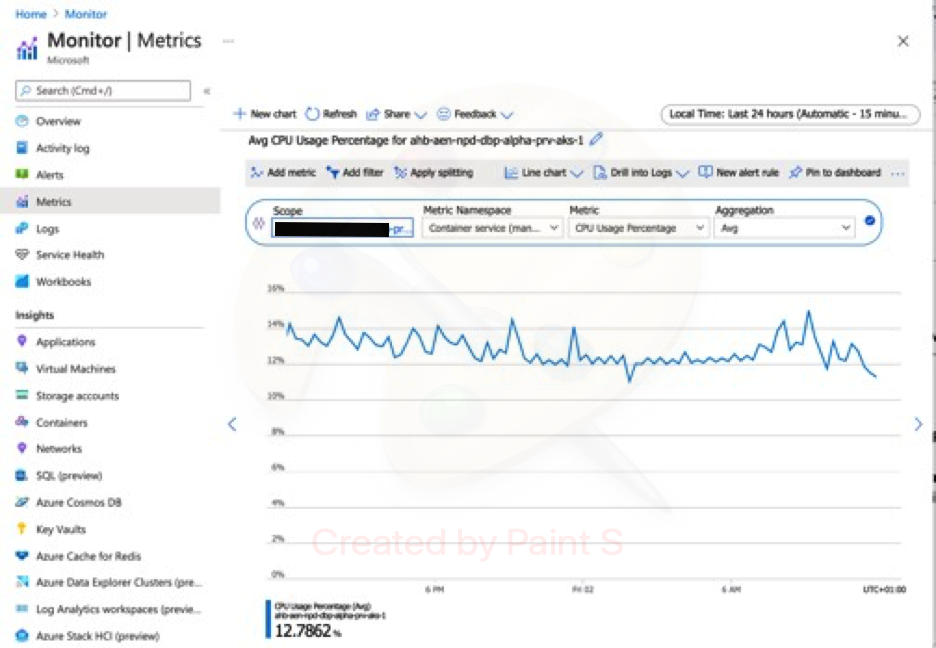
Once selected, you will be taken to the metric page where you can choose the specific metric you wish to see in the graph, e.g. Average CPU Usage Percentage.
Access controls for the component
Access to these services is controlled via Azure RBAC and AAD integration. These resources only accept CRUD operations from the following user or group roles:
- Owner
- Contributor
- Custom Roles
How to deploy the component using Terraform
The Terraform to configure azure monitoring alerts (metric and query-based) and action groups is based within the following repository:
azure-monitor-metric-alert
main.tf
resource “azurerm_monitor_metric_alert” “azure-monitor-metric-alert” {
count = length(var.local_mertic_alert)
name = var.local_mertic_alert[count.index].alert_name
resource_group_name = var.resource_group_name
scopes = var.scopes
description = var.local_mertic_alert[count.index].description
frequency = var.local_mertic_alert[count.index].frequency
criteria {
metric_namespace = var.local_mertic_alert[count.index].metric_namespace
metric_name = var.local_mertic_alert[count.index].metric_name
aggregation = var.local_mertic_alert[count.index].aggregation
operator = var.local_mertic_alert[count.index].operator
threshold = var.local_mertic_alert[count.index].threshold
dimension {
name = var.local_mertic_alert[count.index].dimension_name
operator = var.local_mertic_alert[count.index].dimension_operator
values = var.local_mertic_alert[count.index].dimension_values
}
}
action {
action_group_id = var.action_group_id
}
}
Variable.tf
variable “local_mertic_alert” {
type = list(object(
{
alert_name = string,
description = string,
frequency = string,
metric_namespace = string,
metric_name = string,
aggregation = string,
operator = string,
threshold = number,
dimension_name = string,
dimension_operator = string,
dimension_values = list(string)}))
description = “List of local azure monitor metric alert config values”
default = []
}
variable “scopes”{}
variable “resource_group_name” {}
variable “action_group_id” {
default = []
}
azure-monitor-query-alert
main.tf
resource “azurerm_monitor_scheduled_query_rules_alert” “azure-monitor-query-alert” {
count = length(var.local_query_alert)
name = var.local_query_alert[count.index].alert_name
location = var.location
resource_group_name = var.resource_group_name
action {
action_group = var.action_group_id
email_subject = var.local_query_alert[count.index].email_subject
}
data_source_id = var.data_source_id
description = var.local_query_alert[count.index].alert_description
enabled = var.local_query_alert[count.index].alert_enabled
query = var.local_query_alert[count.index].alert_query
severity = var.local_query_alert[count.index].alert_severity
frequency = var.local_query_alert[count.index].alert_frequency
time_window = var.local_query_alert[count.index].alert_time_window
trigger {
operator = var.local_query_alert[count.index].alert_trigger_operator
threshold = var.local_query_alert[count.index].alert_trigger_threshold
}
}
Variable.tf
variable “local_query_alert”{
type = list(object(
{
alert_name = string,
alert_description = string, #–(Optional) The description of the scheduled query rule.
alert_frequency = string, #–(Required) Frequency (in minutes) at which rule condition should be evaluated. Values must be between 5 and 1440 (inclusive)
email_subject = string,
alert_enabled = bool, #–(Optional) Whether this scheduled query rule is enabled. Default is true
alert_query = string,
alert_severity = number, #–(Optional) Severity of the alert. Possible values include: 0, 1, 2, 3, or 4.
alert_trigger_threshold = number, #–(Required) Result or count threshold based on which rule should be triggered. Values must be between 0 and 10000 inclusive.
alert_time_window = number, #–(Required) Time window for which data needs to be fetched for query (must be greater than or equal to frequency). Values must be between 5 and 2880 (inclusive).
alert_trigger_operator = string #–(Required) Evaluation operation for rule – ‘Equal’, ‘GreaterThan’ or ‘LessThan’.
})
)
}
variable “location” {}
variable “resource_group_name” {}
variable “action_group_id” {
description = “(Required) List of action group reference resource IDs.”
type = set(string)
default = []
}
variable “data_source_id” {
description = “Log Analytics Workspace resource ID where the query need to be executed.”
}
Whenever we need to deploy a metric alert for a resource, we call the azure-monitor-metric-alert module in the code. Whenever we need to deploy a query-based alert rule for a resource, we call the azure-monitor-query-alert module in the code
For example, the below code sample deploys metric and query alerts for the AKS cluster .
main.tf
#– Get Action Group details
data “azurerm_monitor_action_group” “alert_ag” {
resource_group_name = var.alert_rg_name
name = var.alert_ag_name
}
data “azurerm_monitor_action_group” “ag_set” {
count = length(var.action_group_names)
resource_group_name = var.alert_rg_name
name = element(var.action_group_names,count.index)
}
# output the result to the terminal
output “groups_id” {
value = data.azurerm_monitor_action_group.ag_set[*].id
}
#– Set the Azure Monitor Alerts for the AKS Cluster node monitoring
module “azure-monitor-query-alert” {
source = “./modules/monitoring-alerts/azure-monitor-query-alert”
location = module.aks_internal_rg.location
resource_group_name = module.aks_internal_rg.name
action_group_id = data.azurerm_monitor_action_group.ag_set[*].id
data_source_id = data.azurerm_log_analytics_workspace.alpha-log.id
local_query_alert = var.query_alert
}
#–Metric Alerts setting
module “azure-monitor-alerts” {
source = “./modules/monitoring-alerts/azure-monitor-metric-alert”
resource_group_name = module.aks_internal_rg.name
scopes = toset([module.aks_internal_cluster.id])
action_group_id = data.azurerm_monitor_action_group.alert_ag.id
local_mertic_alert = var.local_mertic_alert
}
Variables.tf
##################################################################
## Azure Monitoring – Add Pod Alerts for Namespaces crashing off
##################################################################
variable “log_workspace_name” {}
variable “log_workspace_rg_name” {}
variable “query_alert” {}
variable “local_mertic_alert” {}
variable “diagnostic_setting_name” {}
variable “alert_rg_name”{}
variable “action_group_names” {
default = []
}
variable “evicted_query_alert” {}
<environment>.tfvars
##################################################################
## Azure Monitoring – Add Pod Alerts for Namespaces
##################################################################
log_workspace_name = “log-analytics-workspace0-name”
log_workspace_rg_name = “log-analytics-workspace-resourcegroup-name”
diagnostic_setting_name = “alert-diagnostic-settings-name”
#– Metric Alert Variable for AKS cluster as per the metrics definition document
local_mertic_alert = [
{
alert_name = “alert-rule-name”
description = “Out of Disk status for an individual node”
frequency = “PT30M”
metric_namespace = “Microsoft.ContainerService/managedClusters”
metric_name = “kube_node_status_condition”
aggregation = “Average”
operator = “GreaterThan”
threshold = 0
dimension_name = “Node”
dimension_operator = “Include”
dimension_values = [“*”]
},
]
query_alert = [
{
alert_name = “query-alert-rule-name”
alert_description = “alert-description”
alert_frequency = 60
email_subject = “custom-email-subject line”
alert_enabled = true
alert_query = <<-QUERY
let endDateTime = now(); let startDateTime = ago(2h);
KubeEvents
| where TimeGenerated < endDateTime
| where TimeGenerated >= startDateTime
| where ClusterName =~ “aks-cluster-name” and Namespace =~ “<aks-namespace-name>”
| where ObjectKind =~ ‘Pod’ and Reason =~ ‘BackOff’
| project TimeGenerated, Name, ObjectKind, Reason, Message, Namespace, Count
| order by TimeGenerated desc
QUERY
alert_severity = 0
alert_trigger_threshold = 8
alert_time_window = 60
alert_trigger_operator = “GreaterThan”
},
]
alert_rg_name = “alert-resourcegroup-name”
action_group_names = [“action-group-name”,”action-group-name”,]
An example of how to enable post-deployment configuration (if required)
How to perform a backup and restoration
There is no backup function for Azure Monitor, it is either functional or not functional. In the event that alert rules need to be re-created it will need to be deleted and re-created.
How to conduct DR (fail-over and fail-back) and services recovery
How to scale resources (in/out and up/down) where applicable
Azure handles the scaling and load balancing for these services so there is no requirement for client to be involved in this process.
How to upgrade a resource
This particular resource does not need to be upgraded. In the event that Azure update their service information the resource will need to be updated based on the process outlined by Microsoft Azure for specific scenarios.